How Barometric Shifts Alter Predictive Models for Track, Court, and Field Based Contests
Written by Klara Long · Sep 6, 2026
How Barometric Shifts Alter Predictive Models for Track, Court, and Field Based Contests
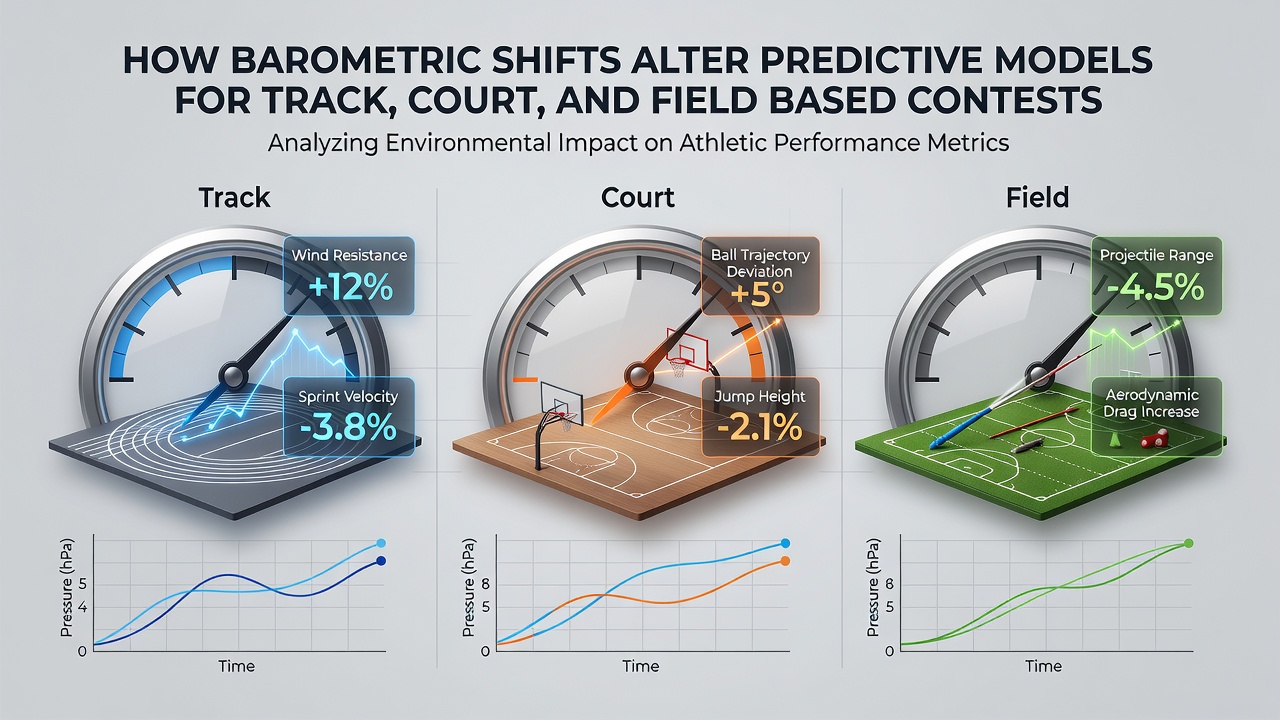
Barometric pressure changes influence air density and oxygen availability, and these factors directly modify performance variables that feed into predictive models for track, court, and field events. Researchers tracking atmospheric data alongside competition results have documented measurable shifts in outcomes when pressure rises or falls by even a few hectopascals. Models that once relied primarily on historical averages now incorporate real-time pressure readings to recalibrate expected times, distances, and point totals.
Core Mechanisms Linking Pressure to Athletic Output
Lower barometric pressure reduces air density, which decreases aerodynamic drag on projectiles while simultaneously lowering the partial pressure of oxygen available for respiration. Higher pressure produces the opposite effect, increasing resistance and slightly improving oxygen uptake at sea level. Studies conducted across multiple continents show that these physical changes translate into performance deltas of 0.5 to 2.5 percent depending on the sport and the magnitude of the pressure swing. Predictive algorithms therefore adjust baseline projections by weighting pressure differentials against athlete-specific physiological profiles.
Track Events and Pressure-Driven Adjustments
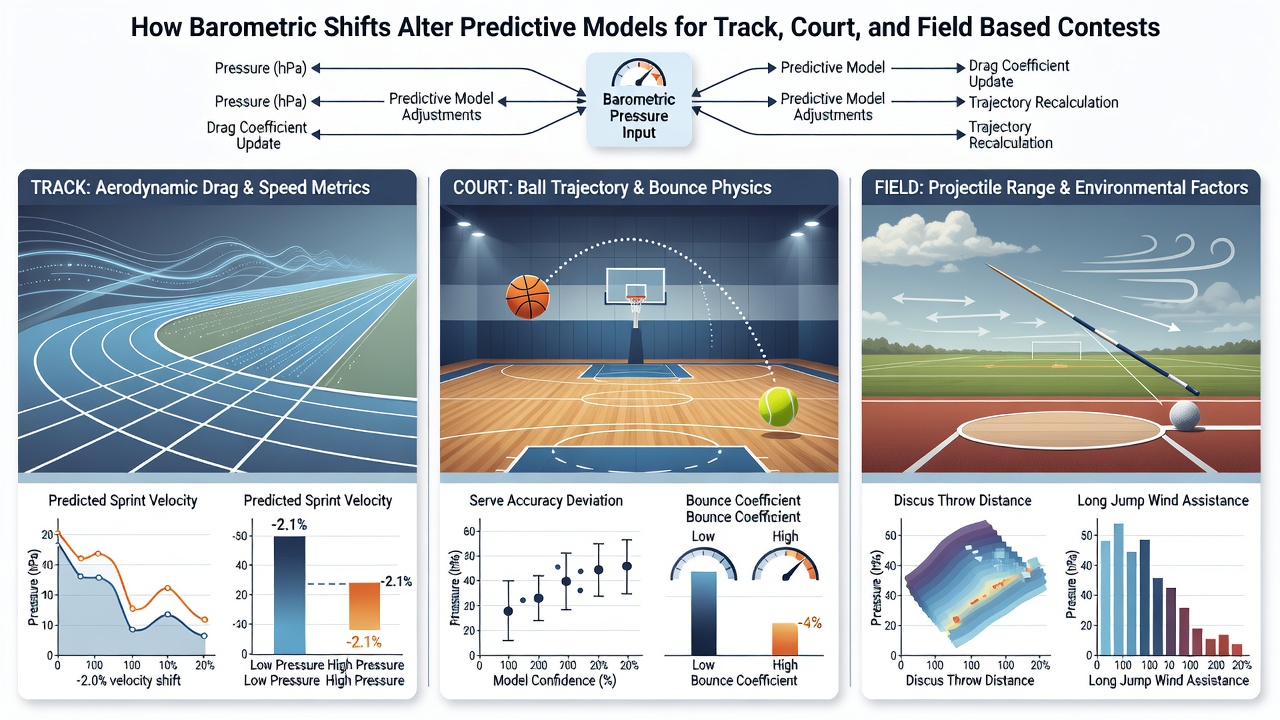
Sprinters experience minimal direct impact from pressure variations because their events last only seconds, yet middle- and long-distance runners show clearer patterns. Data collected during altitude-equivalent pressure drops indicate increased perceived exertion and slower finishing times, particularly above 1,500 meters. Analysts updating models for September 2026 championship cycles have begun layering barometric forecasts into endurance projections, because even modest pressure declines correlate with elevated heart-rate responses at race pace. One dataset from a multi-year monitoring program revealed that a 10-hectopascal drop aligned with average time increases of 1.8 percent in 5,000-meter events.
Court Sports and Ball-Flight Dynamics
Tennis and basketball both involve rapid changes in projectile trajectory that pressure alters through air resistance. Tennis balls travel farther and bounce higher when pressure falls, while increased pressure compresses flight paths and accelerates surface friction effects on the court. Researchers at institutions monitoring professional circuits have integrated pressure-corrected bounce coefficients into simulation engines, allowing forecasts to account for venue-specific atmospheric trends. Basketball shooting percentages also shift measurably; lower pressure reduces drag and can raise three-point success rates by fractions of a percent in controlled comparisons.
Field-Based Contests and Trajectory Modeling
Soccer, baseball, and cricket present the most visible pressure effects because the ball travels through the air for extended periods. Lower pressure extends carry distance for struck or kicked balls, while higher pressure shortens flight and increases knuckleball instability. Australian Bureau of Meteorology records combined with match data demonstrate that home-run rates in baseball rise measurably during low-pressure weather systems, prompting modelers to recalibrate expected scoring outputs. Soccer analysts similarly adjust expected goal totals when pressure gradients alter swing and dip on set pieces. These adjustments now appear in multi-factor algorithms maintained by research groups across North America and Europe.
Integrating Real-Time Data into Predictive Frameworks
Modern forecasting systems pull pressure readings from both on-site sensors and regional weather networks, then apply correction factors derived from regression analyses of past events. Institutions such as the National Oceanic and Atmospheric Administration supply standardized datasets that model developers cross-reference with performance logs. The process involves recalibrating coefficients for drag, lift, and physiological load whenever pressure deviates beyond established thresholds. Teams responsible for these models update weighting schemes quarterly, incorporating new observations from completed seasons to refine accuracy.
Regional Variations and Data Sources
Geographic differences matter because baseline pressure and typical fluctuation ranges vary by latitude and elevation. Venues near coastlines experience different average swings than inland or high-altitude sites, requiring location-specific calibration layers. Reports from the Australian Institute of Sport and Canadian university research groups illustrate how regional pressure norms affect model outputs differently, prompting developers to maintain separate parameter sets rather than applying universal corrections. This approach reduces systematic bias when models are deployed across international calendars.
Conclusion
Barometric pressure shifts have become a standard input for predictive models covering track, court, and field contests because they produce consistent, quantifiable effects on both equipment behavior and human physiology. Organizations maintaining these models continue to refine integration methods as sensor networks expand and additional performance datasets become available. The result is a more precise forecasting environment that accounts for atmospheric conditions alongside traditional statistical variables.